| The Complete Super Bowl |
| Established April 1, 1999 • A Division of Hoffco, Inc. • Not endorsed by the NFL |
| Games • MVPsĀ• StandingsĀ• RecordsĀ• RingsĀ• ProgramsĀ• Pre-Super Bowl • SitemapĀ• About |
|
|
| |
|
"The Eagles weren't ready to play that day and we were. That was the difference. I could see it in Jaworski's eyes on the very first
series. He looked like a guy who realized he was in over his head and didn't know what to do about it. The other players had the same
look. Very tight, very nervous. I knew if we got a quick lead on them, it would be all over. That's how it turned out."
-Raiders LB Matt Millen |
| Oakland Raiders (14-5) |
Philadelphia Eagles (14-4) |
|
|---|---|---|
 |
 |
 |
 |
Oakland -27 Philadelphia -10 |
 |
| Rosters & Coaches | Game Summary | Play-by-Play | MVP Profile | SB Ring | Ticket | Program |
| Super Bowl XV Quick Stats | |
|---|---|
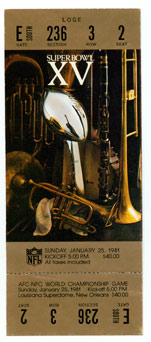
| Date: | January 25, 1981 |
| Location: | Louisiana Superdome - New Orleans, LA |
| Surface: | Indoors on turf |
| Game Weather: | Temp: 72 F (Indoors), High: 62 F Low: 44 F, (Outdoors), Wind: S 7 mph |
| Conditions: | Controlled Climate (Indoors), Mostly Cloudy (Outdoors) |
| Attendance: | 76,135 |
| Kickoff Time: | 5:00 P.M. Central |
| Commentary: | Dick Enberg and Merlin Olsen (NBC) |
| Officials: | Referee: Ben Dreith (12), Umpire: Frank Sinkovitz (20), Line Judge: Tom Dooley (10), Side Judge: Dean Look (9), Head Linesman: Tony Veteri Sr. (8), Back Judge: Tom Kelleher (7), Field Judge: Fritz Graf (17) |
| Pre-Game Show: | Southern University Marching Band (Baton Rouge) |
| National Anthem: | Helen O'Connell |
| Coin Toss: | Marie Lombardi |
| Halftime Show: |
"Mardi Gras Festival" Ftr: Southern University Band (Baton Rouge), Helen O'Connell, Pete Fountain's Half-Fast Group Producer: Jim Skinner |
| Winner Share: | $18,000 |
| Loser Share: | $9,000 |
| Ticket Price: | $40 or $60, depending on seat location (varying ticket colors depending on level) |
| Favorite: | Philadelphia by 3.0 pts. |
| TV Rating: | 44.4, 63 share (NBC) |
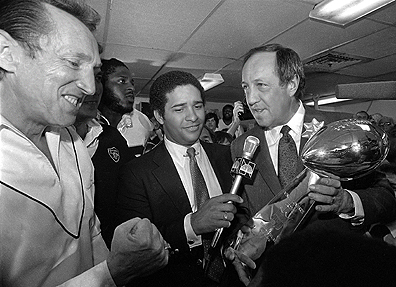
| Most Valuable Player: | Raiders QB Jim Plunkett (13/21, 261 yds, 3 TDs; 3 for 9 yds) |
| 1980 NFL Playoffs | ||||||||||||
|---|---|---|---|---|---|---|---|---|---|---|---|---|
| AFC Wildcard | AFC Divisional | AFC Conference | NFC Conference | NFC Divisional | NFC Wildcard | |||||||
| Houston (11-5) at Oakland (11-5) | 7 27 | Buffalo* (11-5) at San Diego* (11-5) | 14 20 | Oakland (13-5) at San Diego (12-5) | 34 27 | Dallas (14-4) at Philadelphia (13-4) | 7 20 | Minnesota* (9-7) at Philadelphia* (12-4) | 16 31 | Los Angeles (11-5) at Dallas (12-4) | 13 34 | |
| Oakland (12-5) at Cleveland* (11-5) | 14 12 |
Dallas (13-4) at Atlanta* (12-4) | 30 27 |
|||||||||
| 1980 NFL Standings | ||||||||
|---|---|---|---|---|---|---|---|---|
| American Football Conference | ||||||||
| Eastern | Central | Western | ||||||
| Buffalo Bills New England Patriots Miami Dolphins Baltimore Colts New York Jets | 11-5-0 10-6-0 8-8-0 7-9-0 4-12-0 | 0.688 0.625 0.500 0.438 0.250 |
Cleveland Browns Houston Oilers* Pittsburgh Steelers Cincinnati Bengals | 11-5-0 11-5-0 9-7-0 6-10-0 | 0.688 0.688 0.563 0.375 |
San Diego Chargers Oakland Raiders* Kansas City Chiefs Denver Broncos Seattle Seahawks | 11-5-0 11-5-0 8-8-0 8-8-0 4-12-0 | 0.688 0.688 0.500 0.500 0.250 |
| National Football Conference | ||||||||
| Eastern | Central | Western | ||||||
| Philadelphia Eagles Dallas Cowboys* Washington Redskins St. Louis Cardinals New York Giants | 12-4-0 12-4-0 6-10-0 5-11-0 4-12-0 | 0.750 0.750 0.375 0.313 0.250 |
Minnesota Vikings Detroit Lions Chicago Bears Tampa Bay Buccaneers Green Bay Packers | 9-7-0 9-7-0 7-9-0 5-10-1 5-10-1 | 0.563 0.563 0.438 0.344 0.344 |
Atlanta Falcons Los Angeles Rams* San Francisco 49ers New Orleans Saints | 12-4-0 11-5-0 6-10-0 1-15-0 | 0.750 0.688 0.375 0.063 |
|
| |||||||||||||||||||||||||||||||||||||||||||||||||||||||||||||||||||||||||||||||||||||||||||||||||||||||||||||||||||||||||||||||||||||||||||||||||||||||||||||||||||||||||||||||||||||||||||||||||||||||||||||||||||||||||||||||||
| Starting Lineups | ||||||||
|---|---|---|---|---|---|---|---|---|
| OAKLAND | PHILADELPHIA | |||||||
| OFFENSE | DEFENSE | OFFENSE | DEFENSE | |||||
| C.Branch | WR | J.Matuszak | LE | H.Carmichael | WR | D.Harrison | LE | |
| A.Shell | LT | R.Kinlaw | NT | S.Walters | LT | C.Johnson | NT | |
| G.Upshaw | LG | D.Browning | RE | P.Perot | LG | C.Hairston | RE | |
| D.Dalby | C | T.Hendricks | LOLB | G.Morriss | C | J.Bunting | LOLB | |
| M.Marvin | RG | M.Millen | LILB | W.Peoples | RG | B.Bergey | LILB | |
| H.Lawrence | RT | B.Nelson | RILB | J.Sisemore | RT | F.LeMaster | RILB | |
| R.Chester | TE | R.Martin | ROLB | K.Krepfle | TE | J.Robinson | ROLB | |
| B.Chandler | WR | L.Hayes | LCB | J.Spagnola | TE | R.Young | LCB | |
| J.Plunkett | QB | D.O'Steen | RCB | R.Jaworski | QB | H.Edwards | RCB | |
| M.van Eeghen | RB | M.Davis | SS | W.Montgomery | RB | R.Logan | SS | |
| K.King | RB | B.Owens | FS | L.Harris | RB | B.Wilson | FS | |
| Substitutions | ||||||||
|---|---|---|---|---|---|---|---|---|
| OAKLAND | PHILADELPHIA | |||||||
| OFFENSE | DEFENSE | OFFENSE | DEFENSE | |||||
| T.Christensen (RB) | J.Campbell (DE) | B.Campfield (RB) | T.Brown (DE) | |||||
| D.Jensen (RB) | C.Hardman (DE) | L.Giammona (RB) | C.Humphrey (DE) | |||||
| I.Matthews (RB) | W.Jones (DE) | P.Harrington (RB) | K.Clarke (DT) | |||||
| A.Whittington (RB) | D.Pear (DT) | W.Henry (WR) | A.Chesley (LB) | |||||
| M.Bradshaw (WR) | J.Barnes (LB) | R.Parker (WR) | R.Phillips (LB) | |||||
| R.Martini (WR) | M.Celotto (LB) | C.Smith (WR) | R.Wilkes (LB) | |||||
| D.Ramsey (TE) | R.McClanahan (LB) | M.Slater (C) | R.Blackmore (DB) | |||||
| B.Davis (T) | M.Jackson (DB) | R.Baker (G) | Z.Henderson (DB) | |||||
| L.Mason (T) | O.McKinney (DB) | S.Kenney (T) | J.Sciarra (DB) | |||||
| S.Sylvester (G) | K.Moody (DB) | |||||||
| KICKERS | KICKERS | |||||||
| C.Bahr (K) | R.Guy (P) | T.Franklin (K) | M.Runager (P) | |||||
| DID NOT PLAY | DID NOT PLAY | |||||||
| M.Wilson (QB) | R.Hertel (QB) | J.Pisarcik (QB) | ||||||
| B.Torrey (RB) | ||||||||
|
1st Quarter
| |||||||||||||||||||||||||||||||||||||||||||||||||||||||||||||||||||||||||||||||||||||
| ||||||||||||||||||||||||||||||||||||||||||||||||||||||||||||||||||||||||||||||||||||||||||||||||||||||||||||||||||||||||||||||||||||||||||||||||||||||||||||||||||||||||||||||||||||||||||||||||||||||||||||||||||||||||||||||||||||||||||||||||||||||||||||||||||||||||||||||||||||||||||||||||||||||||||||||||||||||||||||||||||||||||||||||||||||||||||||||||||||||||||||||||||||||||||||||||||||||||||||||||||||||||||||||||||||||||||||||
| |||||||||||||||||||||||||||||||||||||||||||||||||||||||||||||||||||||||||||||||||||||||||||||||||||||||||||||||||||||||||||||||||||||||||||||||||||||||||||||||||||||||||||||||||||||||||||||||||||||||||||||||||||||||||||||||||||||||||||||||||||||||||||||||||||||||||||||||||||||||||||||||||||||||||||||||||||||||||||||||||||||||||||||||||||||||||||||||||||||||||||||||||||||||||||||||||||||||||||||||||||||||||||||||||||||||||||||||||||||||||||||||||||||||||||||||||||||||||||||||||||||||||||||||||||||||||||||||||||||||||||||||||||||||||||||||||||||||||||||||||||||||||||||||||||||||||||||||||||||||||||||||||||||||||||||||||||||||||||||||||||||||||||||||||||||||||||||||||||||||||||||||||||||||||||||||||||||||||||||||||||||||||||||||||||||||||||||||||||||||||||||||||||||||||||||||||||||||||||||||||||||||||||||||||||||||||||||||||||||||||||||||||||||||||||||||||||||||||||||||||||||||||||||||||||||||||||||||||||||||||||||||||||||||||||||||||||||||||||||||||||||||||||||||||||||||||||||||