| The Complete Super Bowl |
| Established April 1, 1999 • A Division of Hoffco, Inc. • Not endorsed by the NFL |
| Games • MVPsĀ• StandingsĀ• RecordsĀ• RingsĀ• ProgramsĀ• Pre-Super Bowl • SitemapĀ• About |
|
|
| |
|
"We never scored enough points to win a Super Bowl. Everybody says you win with great defense. I don't believe that.
Great defense can keep you in the game, but you win it with great offense. Most of the winning Super Bowl teams had
great offensive games." -Vikings LB Wally Hilgenberg, reflecting on four Super Bowl losses |
| Oakland Raiders (15-1) |
Minnesota Vikings (13-2-1) |
|
|---|---|---|
 |
 |
 |
 |
Oakland -32 Minnesota -14 |
 |
| Rosters & Coaches | Game Summary | Play-by-Play | MVP Profile | SB Ring | Ticket | Program |
| Super Bowl XI Quick Stats | |
|---|---|
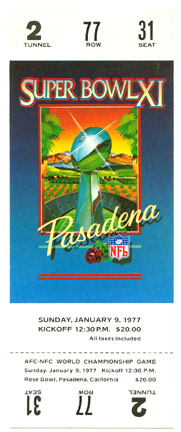
| Date: | January 9, 1977 |
| Location: | Rose Bowl - Pasadena, CA |
| Surface: | Outdoors on grass |
| Game Weather: | Clear and Sunny |
| Conditions: | Temp: 58 F |
| Attendance: | 103,438 |
| Kickoff Time: | 12:30 P.M. Pacific |
| Commentary: | Curt Gowdy and Don Meredith (NBC) |
| Officials: | Referee: Jim Tunney (32), Umpire: Lou Palazzi (51), Line Judge: Bill Swanson (38), Head Linesman: Ed Marion (26), Back Judge: Tom Kelleher (25), Field Judge: Arman Terzian (23) |
| Pre-Game Show: | Los Angeles Unified School District All-City Band and Ashley Whippet |
| National Anthem: | Vicki Carr (America the Beautiful) |
| Coin Toss: | The Referee |
| Halftime Show: |
"It's A Small World" Ftr: Los Angeles Unified All-City Band and crowd participation Producer: Disney |
| Winner Share: | $15,000 |
| Loser Share: | $7,500 |
| Ticket Price: | $20 |
| Favorite: | Oakland by 4.5 pts. |
| TV Rating: | 44.4, 73 share (NBC) |
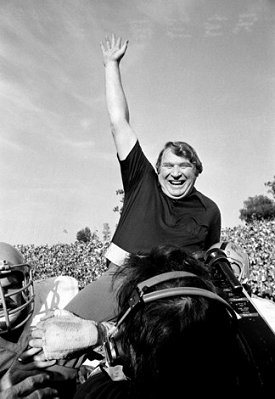
| Most Valuable Player: | Raiders WR Fred Biletnikoff (4 rec, 79 yds) |
| 1976 NFL Playoffs | ||||||||||||
|---|---|---|---|---|---|---|---|---|---|---|---|---|
| AFC Divisional | AFC Conference | NFC Conference | NFC Divisional | |||||||||
| New England (11-3) at Oakland* (13-1) | 21 24 |
Pittsburgh (11-4) at Oakland (14-1) | 7 24 |
Los Angeles (12-3-1) at Minnesota (12-2-1) | 13 24 |
Washington (10-4) at Minnesota* (11-2-1) | 20 35 | |||||
| Pittsburgh* (10-4) at Baltimore* (11-3) | 40 14 | Los Angeles* (10-3-1) at Dallas* (11-3) | 14 12 |
|||||||||
| 1976 NFL Standings | ||||||||
|---|---|---|---|---|---|---|---|---|
| American Football Conference | ||||||||
| Eastern Division | Central Division | Western Division | ||||||
|
Baltimore Colts New England Patriots* Miami Dolphins New York Jets Buffalo Bills | 11-3-0 11-3-0 6-8-0 3-11-0 2-12-0 | 0.786 0.786 0.429 0.214 0.143 |
Pittsburgh Steelers Cincinnati Bengals Cleveland Browns Houston Oilers | 10-4-0 10-4-0 9-5-0 5-9-0 | 0.714 0.714 0.643 0.357 |
Oakland Raiders Denver Broncos San Diego Chargers Kansas City Chiefs Tampa Bay Buccaneers | 13-1-0 9-5-0 6-8-0 5-9-0 0-14-0 | 0.929 0.643 0.429 0.357 0.000 |
| National Football Conference | ||||||||
| Eastern Division | Central Division | Western Division | ||||||
|
Dallas Cowboys Washington Redskins* St. Louis Cardinals Philadelphia Eagles New York Giants | 11-3-0 10-4-0 10-4-0 4-10-0 3-11-0 | 0.786 0.714 0.714 0.286 0.214 |
Minnesota Vikings Chicago Bears Detroit Lions Green Bay Packers | 11-2-1 7-7-0 6-8-0 5-9-0 | 0.821 0.500 0.429 0.357 |
Los Angeles Rams San Francisco 49ers Atlanta Falcons New Orleans Saints Seattle Seahawks | 10-3-1 8-6-0 4-10-0 4-10-0 2-12-0 | 0.750 0.571 0.286 0.286 0.143 |
|
| ||||||||||||||||||||||||||||||||||||||||||||||||||||||||||||||||||||||||||||||||||||||||||||||||||||||||||||||||||||||||||||||||||||||||||||||||||||||||||||||||||||||||||||||||||||||||||||||||||||||||
| Starting Lineups | ||||||||
|---|---|---|---|---|---|---|---|---|
| OAKLAND | MINNESOTA | |||||||
| OFFENSE | DEFENSE | OFFENSE | DEFENSE | |||||
| C.Branch | WR | J.Matuszak | LE | A.Rashad | WR | C.Eller | LE | |
| A.Shell | LT | D.Rowe | DT | S.Riley | LT | D.Sutherland | DT | |
| G.Upshaw | LG | O.Sistrunk | DT | C.Goodrum | LG | A.Page | DT | |
| D.Dalby | C | P.Villapiano | RE | M.Tingelhoff | C | J.Marshall | RE | |
| G.Buenier | RG | M.Johnson | LLB | E.White | RG | M.Blair | LLB | |
| J.Vella | RT | W.Hall | MLB | R.Yary | RT | J.Siemon | MLB | |
| D.Casper | TE | T.Hendricks | RLB | S.Voigt | TE | W.Hilgenberg | RLB | |
| F.Biletnikoff | WR | S.Thomas | LCB | S.White | WR | N.Wright | LCB | |
| K.Stabler | QB | W.Brown | RCB | F.Tarkenton | QB | B.Bryant | RCB | |
| C.Davis | RB | G.Atkinson | SS | B.McClanahan | RB | J.Wright | SS | |
| M.van Eeghen | RB | J.Tatum | FS | C.Foreman | RB | P.Krause | FS | |
| Substitutions | ||||||||
|---|---|---|---|---|---|---|---|---|
| OAKLAND | MINNESOTA | |||||||
| OFFENSE | DEFENSE | OFFENSE | DEFENSE | |||||
| D.Humm (QB) | H.McMath (DE) | B.Lee (QB) | M.Mullaney (DL) | |||||
| M.Rae (QB) | D.Medlin (DE) | S.Craig (TE) | J.White (DL) | |||||
| W.Bankston (RB) | C.Philyaw (NT) | B.Grim (WR) | A.Martin (LB) | |||||
| M.Bradshaw (WR) | R.Barnes (LB) | L.Willis (WR) | F.McNeill (LB) | |||||
| M.Siani (WR) | R.Bonness (LB) | R.Groce (RB) | R.Winston (LB) | |||||
| P.Banaszak (RB) | F.Rice (LB) | S.Johnson (RB) | N.Allen (DB) | |||||
| C.Garrett (RB) | N.Colzie (DB) | R.Miller (RB) | A.Beamon (DB) | |||||
| H.Ginn (RB) | C.Phillips (DB) | D.Dumler (G) | W.Hall (DB) | |||||
| M.Moore (RB) | ||||||||
| S.Sylvester (G) | ||||||||
| H.Lawrence (T) | ||||||||
| KICKERS | KICKERS | |||||||
| E.Mann (K) | R.Guy (P) | F.Cox (K) | N.Clabo (P) | |||||
| DID NOT PLAY | DID NOT PLAY | |||||||
| B.Berry (QB) | B.Buetow (T) | |||||||
|
2nd Quarter
| |||||||||||||||||||||||||||||||||||||||||||||||||||||||||||||||||||||||||||||||||||||
| ||||||||||||||||||||||||||||||||||||||||||||||||||||||||||||||||||||||||||||||||||||||||||||||||||||||||||||||||||||||||||||||||||||||||||||||||||||||||||||||||||||||||||||||||||||||||||||||||||||||||||||||||||||||||||||||||||||||||||||||||||||||||||||||||||||||||||||||||||||||||||||||||||||||||||||||||||||||||||||||||||||||||||||||||||||||||||||||||||||||||||||||||||||||||||||||||||||||||||||||||||||||||||||||||||||||||||||||||||||||||||||||||||||||||||
| |||||||||||||||||||||||||||||||||||||||||||||||||||||||||||||||||||||||||||||||||||||||||||||||||||||||||||||||||||||||||||||||||||||||||||||||||||||||||||||||||||||||||||||||||||||||||||||||||||||||||||||||||||||||||||||||||||||||||||||||||||||||||||||||||||||||||||||||||||||||||||||||||||||||||||||||||||||||||||||||||||||||||||||||||||||||||||||||||||||||||||||||||||||||||||||||||||||||||||||||||||||||||||||||||||||||||||||||||||||||||||||||||||||||||||||||||||||||||||||||||||||||||||||||||||||||||||||||||||||||||||||||||||||||||||||||||||||||||||||||||||||||||||||||||||||||||||||||||||||||||||||||||||||||||||||||||||||||||||||||||||||||||||||||||||||||||||||||||||||||||||||||||||||||||||||||||||||||||||||||||||||||||||||||||||||||||||||||||||||||||||||||||||||||||||||||||||||||||||||||||||||||||||||||||||||||||||||||||||||||||||||||||||||||||||||||||||||||||||||||||||||||||||||||||||||||||||||||||||||||||||||||||||||||||||||||||||||||||||||||||||||||||||||||||||||||||||||||||||||||